


.svg)
Logging in AWS – A Journey of Discovery


Logging in AWS – a journey of discovery
Logging in AWS is a tricky thing to get right. This blog will take you through a journey of discovery for AWS log ingestion. It won’t spend too much time discussing classic topics, like why you should deploy logging solutions, because you can find that information anywhere.
Instead, it’ll cover what we at Immersive think good logging architecture should entail, evaluate alternative options for log indexing and real-time monitoring, and take you through the nuances and ‘gotchas’ we encountered along the way – the kind of information that’s not so easy to find online without delving into the docs.
Laying the foundation – log ingestion
The first part of any logging stack is log ingestion. You need to deploy or configure tools to generate logs that you’ll eventually index and analyze. But there are so many different things to log.
Fortunately, there are also many specialized services in AWS for logging. You can have CloudTrail tracking management and API events, VPC flow logs logging network traffic, EC2 load balancers delivering HTTP request logs, and so much more!
Let’s start with CloudTrail.
CloudTrail management logs
AWS CloudTrail is automatically enabled in AWS accounts and records activity within the management console, API calls, access via command line tools, and actions taken on your behalf by other AWS services. These are recorded as events that are stored in S3 as JSON objects, bundled together in five-minute periods. You can forward these to CloudWatch as a log group, which is recommended if you want to be able to search them in AWS.
CloudTrail is a good starting point for logging in AWS and covers a lot of the resource-level interactions you’ll be interested in. Ensuring it’s set up as a multi-region trail (so it actually covers everything going on in your account) and forwarding to CloudWatch logs will give you a solid foundation for incident investigation.
VPC flow logs
VPC flow logs are another core area of any comprehensive logging architecture in AWS. Flow logs capture IP traffic through network interfaces across your AWS estate. They’re essential for visibility of the network traffic flowing through your VPCs and subnets and reaching your EC2 instances.
Flow logs capture information such as the source IP address, destination IP, port of traffic, and protocol. This information is a good starting point for identifying malicious activity and provides early indicators of attacks. For example, if flow logs show a connection on port 22 to your web instances, it may be suspicious. You could mitigate the risk by simply blocking the offending IP address.
Like many AWS service logs, you have the option to capture and view flow logs in CloudWatch or export them to S3. This makes them a powerful tool for logging and monitoring VPC traffic – and flow logging should be included in any good logging solution. You can learn more about VPC flow logs in the lab linked below.
Load balancer logging
Access logs for load balancers in your account give detailed information about requests sent to your applications. These logs cover transport layer information, including the request from the client, domain information, and encryption protocol details. This contrasts with VPC flow logs, which capture network-level information in your AWS account.
Access logs can be quite cost effective. You only get charged for the S3 storage of the compressed log files that are aggregated every five minutes and sent to a bucket, similar to how CloudTrail stores logs. It’s disabled by default but is easy to enable in the console, or via Terraform or CloudFormation if you’re deploying infrastructure as code. While EC2 load balancing publishes metrics to CloudWatch, we couldn’t find a simple way to forward the log files themselves to a log group, which can make it hard to search these from within AWS.
Server access logging
You’ll also want to log what’s actually happening on your servers. This is where your logging configuration and tools will depend on the specifics of your workload. The CloudWatch agent is compatible with a wide range of operating systems and allows you to publish detailed system-level metrics from your instance to a log group. For instances running Windows Server OS or a wide selection of available Linux distributions, you can also specify log files on the box you want to be forwarded to the log group, which can massively simplify your application monitoring.

…and a few other services
It’s worth noting here that the above services aren’t the only ones with built-in logging capabilities. For example, CloudFront can create log files that detail user requests across your content delivery network, and AWS X-Ray is capable of tracking and tracing a request’s journey through serverless applications in Lambda.
To maintain full visibility over your AWS estate and monitor for suspicious activity, it’s important to deploy the correct log ingestion tools for all your resources and services. But this is starting to look like a lot of separate log inputs…
Combining this all together
Once you’ve got all your systems deployed to log management actions, network traffic, HTTP requests, and more, what’s next?
You need to be able to view and act on these logs, preferably from one place. You can perform centralized logging with CloudWatch or with third-party security information and event management (SIEM) tools. Both have their advantages and disadvantages.
Centralized logging with CloudWatch
AWS offers its own log indexing solutions via integration with CloudWatch and Kinesis. It’s AWS-native so can be rapidly deployed across multiple accounts and regions using CloudFormation templates. In addition, it’s easy to integrate with other AWS services because most log ingestors (including CloudTrail and VPC flow logs) can send logs straight to CloudWatch at the click of a button.
When compared to third-party SIEM tools like Splunk, CloudWatch’s easy integration gives it a core advantage: minimal additional configuration is required. Furthermore, if you aren’t already paying for and using a SIEM elsewhere, remaining native to AWS by indexing logs with CloudWatch and Kinesis can keep costs down.
Another advantage of using CloudWatch is how easy it is to create custom AWS automation based on activity in your account. Logs ingested in CloudWatch can be analyzed to determine metrics – such as the number of account logins within five minutes. You can then configure alarms to take action when these metrics reach certain thresholds, send emails via the SNS service, and take automated action on infrastructure using Lambda functions, all within a single AWS account.
But this only really applies if your entire application stack is AWS-native. This is a pretty major downfall of CloudWatch; if you try to index logs from sources external to AWS, it can get very complex. That’s where third-party SIEMs come into play.
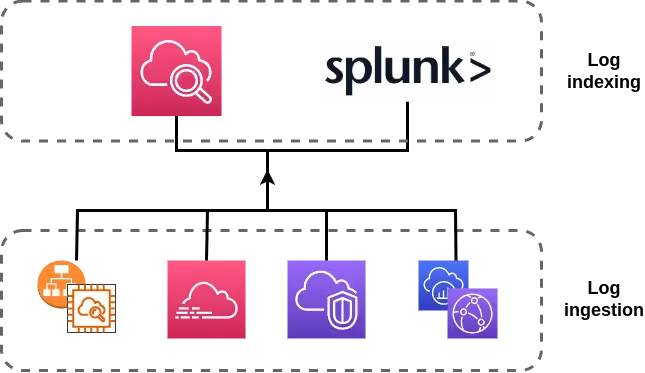
Centralized logging with third-party SIEMs
Third-party SIEMS are specially designed to index logs from a wide variety of sources. Many, such as Splunk, offer pre-made add-ons to index logs from major sources, including AWS. This reduces the complexity of consuming logs from AWS and makes them perfect for centralizing logs from AWS with logs from other sources (such as on-premise servers).
One core advantage of this is that your security team can monitor logs from across your digital estate in a single location. In addition, integrating multiple feeds into one SIEM can crucially reduce time to remediation during a breach.
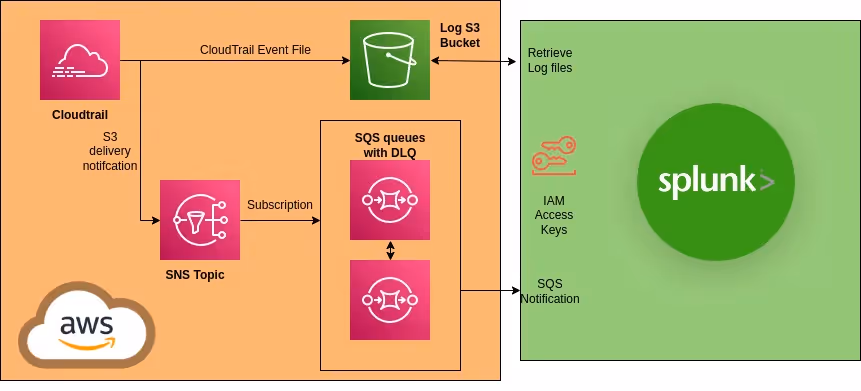
A common architecture for retrieving AWS logs into third-party SIEMs is to:
- Configure log ingestors in AWS to deliver logs to S3
- Set up S3 log notifications to Amazon SNS
- Subscribe Splunk to an SQS queue to regularly retrieve the logs
Along with the benefits of integrating your logs from AWS with those from other sources, there are also some downsides.
The SIEM needs some form of credentials to retrieve your logs from AWS. In Splunk’s case, it recommends creating an IAM user and attaching a user policy that it provides and which contains all relevant permissions. The access keys for this user are then stored on the Splunk server. Like any form of authentication, appropriate secret management should be used, rather than keeping the credentials as plaintext on the Splunk server.
Another point worth considering is that different AWS services may require different methods of log ingestion. For CloudTrail and HTTP logs, we were able to set up the S3 notifications and SQS queues as described above, but some logs don’t reside in S3. If you want to combine logs that are stored in CloudWatch and S3, that’ll require different setups. And if you have workloads across multiple accounts, this setup will have to be performed in each account. It can be automated with infrastructure as code, but working out the particulars of fitting the required resources into your bespoke design will likely take time to plan and implement. Splunk comes with an add-on for ingesting logs from AWS that simplifies things – but other SIEMs could prove more complicated.
Even with these potential speed bumps in moving AWS logs around, we still think using a third-party SIEM for centralizing AWS logs is beneficial – especially if you’re already using one elsewhere or are going to house infrastructure in multi-cloud or hybrid cloud environments.
The benefits of having logs aggregated in one place are simply too good to ignore. That said, if you’re purely hosting on AWS and don’t have an existing third-party SIEM solution to hook into, it’s definitely worth considering CloudWatch to reduce complexity.
Nuances and ‘gotchas’
Some people are well versed in AWS and logging, and might think this is all easy so far. But there are a few nuances and ‘gotchas’ that we encountered along the way. CloudTrail is fairly easy to use, but it still has some a couple of things to be aware of – especially if you plan to use it as your source of truth in AWS and don’t want to find out about them the hard way.
CloudTrail regions
The first is widely known and emphasizes the importance of having a multi-region trail enabled. All events that occur in global services, like IAM, are treated as happening in the us-east-1 region.
This is important to remember when trying to piece together a set of actions that happened in your account; you should always include the us-east-1 region in searches and ensure any indexing includes the region. For example, if an attacker were performing reconnaissance on resources in eu-west-2 but then escalated the permissions on the role they had access to, that would be recorded in the us-east-1 region.
CloudTrail default functionality is simply not enough
It’s great that basic CloudTrail functionality is enabled by default in AWS accounts. It lets people see the value of logging without having to set it up themselves. That being said, the default functionality should in no way be relied upon as a complete logging and monitoring solution.
The logs are only viewable in the AWS console and available for 90 days. As a minimum, a dedicated trail should be enabled, which then means logs will be stored in S3. If you want to view logs in the AWS console, we recommend also forwarding them to a CloudWatch log group where you have control over the retention period. Setting up a dedicated trail will also prompt you to decide exactly what you want CloudTrail to log in the account, such as object-level API calls in S3.
Logging delays
Another thing to bear in mind is the elapsed time between events taking place and logs appearing in the event history panel or in the S3 bucket. The official documentation stipulates that CloudTrail “typically delivers logs within an average of about 15 minutes of an API call.”
In our experience, 15 minutes is at the longer end of things. We usually see logs being generated in the 5–10 minute range, but this should highlight the fact that CloudTrail won’t work for live monitoring.
If an attacker has gained access to your account and you’re relying on spotting the log in CloudTrail before they’ve done anything, you’re not going to have a good time – any alerting set up to detect specific events will always be delayed. This issue is compounded if you’re exporting to a third-party SIEM tool as this may only collect logs every five minutes. That means you’re up to a possible delay of 20 minutes between the API call occurring and seeing the log.
Default permissions recommended by your third-party SIEM
When we were setting up Splunk to ingest logs, we followed the documentation which helpfully gave us a pre-made IAM policy to deploy for the IAM user that Splunk assumes for authentication. These permissions are designed to make it easy for the user but can be far more permissive than required. As a minimum, you should look them over and ensure that each specific action is required for the areas of the tool you’re using.
Splunk also doesn’t know the names of the resources it will interact with, so the resource section of the policy is set as a wildcard. We strongly recommend against using this. You can improve this by splitting the actions for different services out into different statements within the policy and specifying the resource ARNs that it will need access to.
Disabling logging
A common step in the AWS kill chain is for attackers to disable logging and monitoring in your account. An example of this would be disabling alarms and stopping trails from logging, which is easy for an attacker if they have the necessary permissions, but significantly reduces your visibility of the incident. Therefore you should minimally scope IAM permissions and policies to restrict who can configure logging services.
Key takeaways
Hopefully, you’ve learnt a lot from this blog post. But if there are three things you really ought to remember, it’s these:
- A good logging architecture should collect logs from all of the services that you use
- Unless your entire digital estate is AWS-native, you’re better off logging to a third-party SIEM
- Logging in AWS can work beautifully when done right, but there are lots of things to watch out for – take time to consider all options when designing and implementing log architecture
Want to find out more?
To learn more about the topics covered in this blog and get hands on with many of the services and logging tools mentioned, check out Immersive Labs AWS Logging and Monitoring series linked below.
Logging & Monitoring in AWS Series


.svg)


Ready to Get Started?
Get a Live Demo.
Simply complete the form to schedule time with an expert that works best for your calendar.